Excel report
Summary
We provide the functionality to request a report formatted as an Excel spreadsheet that summarises all the data available under a case including:
- Income Analysis
- Returns the same data you can find in our Income & Employer Verification endpoints here
- Affordability Analysis
- Returns the same data you can find in our Affordability Analysis endpoints here
- Payslip Completeness
- Returns the result of running the
Last 3 months of payslipsCompleteness Checklist for the case which can be found under the Validation Checklist endpoints
- Returns the result of running the
- Bank Statement Completeness
- Returns the result of running the
Last 3 months of bank transactionsCompleteness Checklist for the case which can be found under the Validation Checklist endpoints
- Returns the result of running the
- Integrity Checks
- Returns the same data you can find in our Integrity Checks
The report is available both in the Portal and via our API. In the Portal, you can access it by opening a case and navigating to the Insights tab. If you prefer to retrieve it programmatically, the report is also available through our API — see the API reference for details.
NoteA report will only contain the data that is available for a case i.e. if you have not provided any files that can be used in either income or affordability analysis then you will not see these tabs in the generated report.
Income & Normalisation
As part of our calculations in the Income and Affordability tabs of the spreadsheet we will (among other things) always show a normalised amount per income source / typical month total. To give a high level overview we:
- find the earliest start and latest end date in all valid bank statements
- calculate the elapsed number of days we have transaction data for (three months is around 90 days for example)
- create a multiplier that takes in the elapsed number of days and scales it to a standard year e.g.
90 * (12 / 365) ≈ 2.96 - use the multiplier on every transaction so that it is scaled/weighted relative to a year so we know how much it's actually worth on a given day / month.
The reason why we do this instead of a "simple" average is to try and avoid over/under inflating any transactions - especially when it comes to income as the following factors could skew a simple average over multiple months:
- the number of working days in each month not being the same
- the amount a person is paid from their job varying from paycheck to paycheck (e.g. they have irregular hours, overtime, commission etc)
- the frequency someone is paid (e.g. Weekly, TwoWeekly, Monthly etc)
- someone might provide three or more months of bank statements, but only have a few weeks of actual income
- bank statements covering multiple months and individual transactions either being one off payments that do not repeat again or only repeat for part of the total elapsed period
- joint applications that do not provide the same amount of transaction history - e.g. a couple that provides 3 months of transactions for one person and 2 months for the other
This is perhaps best illustrated with the example below:
Worked exampleLet's say you provide the current account bank statements for John Smith for June, July, and August with a start and end date range of 2025-06-01 to 2025-08-31 giving a period of 91 days.
He is paid the same amount of 1450.43 every month on the 1st and we have transactions showing this for 2025-06-01 and 2025-07-01 but nothing for the month of August (so we're missing around ~30 days of expected income).
First calculate the multiplier. We work out what a day is worth from the number of months divided by the number of days. We can then multiply this by the period :
91 * (12 / 365) ≈ 2.99 (which gets rounded to 3)
With this multiplier we can then divide the amount of each transaction (1450.43) by the multiplier (3) to get the final amount that represents for the 91 day period how much income a person is likely to have in any given month from this specific source:
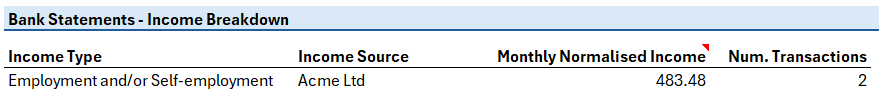
1450.43 / 3 ≈ 483.48 (rounded up from 483.47666...)
This will look something like the following in the Insights Excel Report:
If we had simply calculated the daily income by dividing the amount by the average number of days in any given month (30.44):
1450.43 / 30.44 = 47.65 (rounded)
Then multiplied this by the total number of days in the period:
47.65 * 91 = 4336.15
Then divided this by the number of months we have statements for to get a monthly figure (3):
4336.15 / 3 = 1,445.38
Then we would have massively over inflated the income for John as he has only received £2,900.86 in income over the entire statement period, but we would have been suggesting that for any single month from June, July and August he would have around £1,445.38 available as income.
Note: there are additional calculations that have been left out of the above example for ease of explanation that handle edge cases around individuals with non-monthly salaries among other things.
Updated 28 days ago